
On 24 May 2017, the KSE-100 hit a record 52,876 points. On 25 March 2020, it touched 27,228, its lowest level in five years. By the end of 2025 it stood at 174,054. Each of those turns had a different headline, but the market cycles PSX investors went through followed a familiar order.
In short, PSX cycles repeat because Pakistan's economy repeats a pattern. Growth pulls in imports, the current account deficit widens, the rupee and inflation come under pressure, and the State Bank of Pakistan (SBP) raises interest rates, often alongside an IMF programme. Shares fall and get cheap. Once stability returns and rates start falling, the market has historically tended to recover, usually well before the economy feels better.
The Four Stages of a PSX Cycle
The order below is our reading of SBP's own explanations across its yearly Financial Stability Reviews. The dates differ each time; the sequence rarely does.
- Expansion. Rates are low, credit is cheap and confidence is high. Imports and the current account deficit grow with the economy.
- Strain. The external gap widens, foreign exchange reserves come under pressure and the rupee weakens. Inflation picks up.
- Tightening. The SBP raises the policy rate, the government cuts back demand and an IMF programme often follows. Earnings expectations fall, safe returns rise, and the KSE-100 de-rates.
- Recovery. The deficit narrows, inflation peaks and rates begin to fall. Investors have tended to move money from deposits back into shares, and a new expansion has usually followed.
The KSE-100 tends to turn at stage 3, while the news is still bad, which is why market sentiment often looks wrong at the turning points.
Market Cycles PSX Investors Have Lived Through
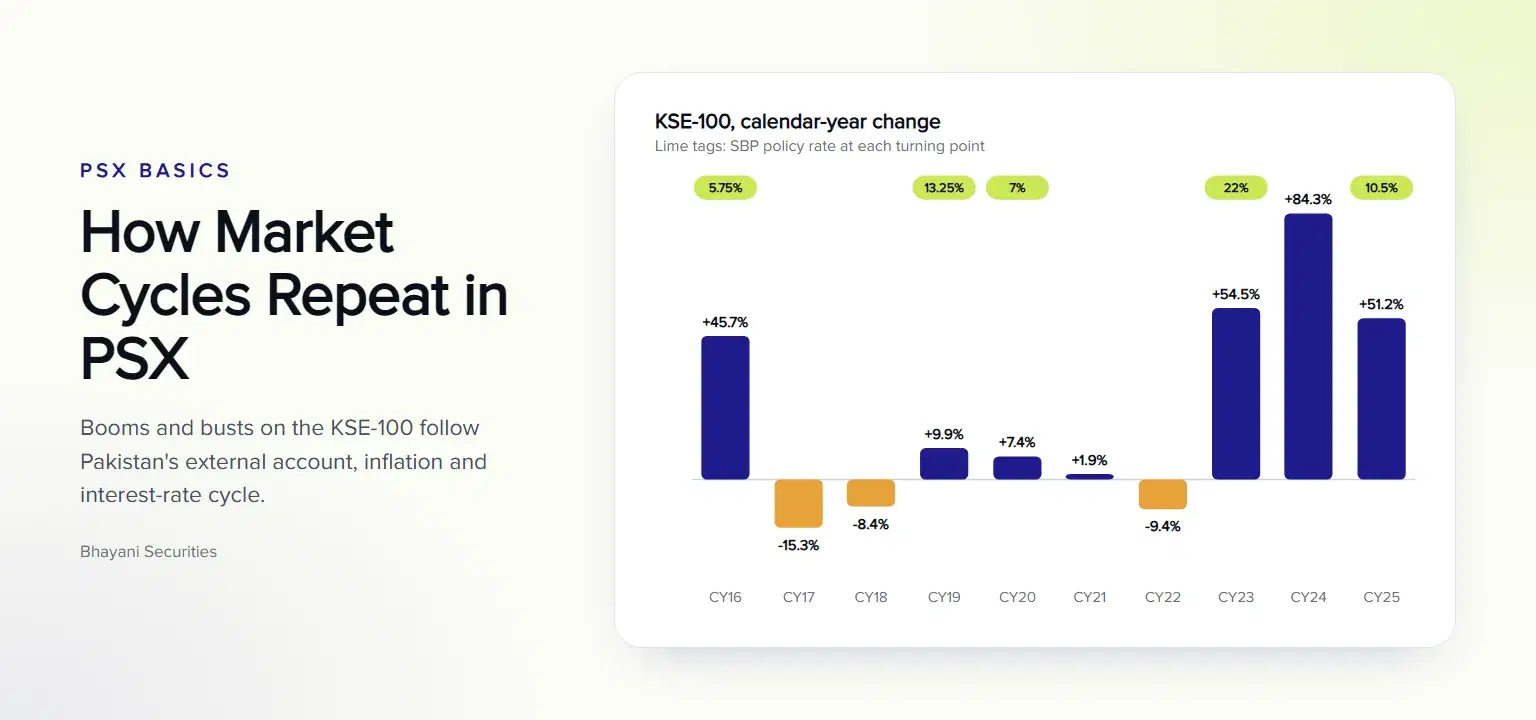
The table pulls together the KSE-100's yearly moves and the policy backdrop the SBP described for each year.
KSE-100 by calendar year, with the rate backdrop
| Year | KSE-100 change | Policy rate backdrop | Context |
| 2008 crisis | Fell 58.3% | Crisis period | Largest fall on record cited by the SBP (FSR 2017) |
| CY16 | +45.7% | 5.75% from May 2016 | Bull run toward the May 2017 record |
| CY17 | -15.3% | 5.75% | Record high in May; new equity taxes, weak MSCI inflows, political uncertainty |
| CY18 | -8.4% | Hikes from January 2018 | Widening twin deficits, inflation, rupee depreciation |
| CY19 | +9.9% | 13.25% from July 2019 | Stabilisation measures, IMF first review completed |
| CY20 | +7.4% | Cut to 7% by June 2020 | Covid crash to 27,228, then recovery |
| CY21 | +1.9% | 7% until September 2021 | Gains slowed as hikes began |
| CY22 | -9.4% | Repeated hikes | External and fiscal deficits, inflation, floods, IMF review delays |
| CY23 | +54.5% | 22% from 27 June 2023 | Almost all gains in the second half |
| CY24 | +84.3% | Cuts from June 2024 | Lower inflation, successful IMF programme, rate cuts |
| CY25 | +51.2% | Down to 10.5% by December | Lower rates, improved macro outlook |
Sources: SBP Financial Stability Reviews (2017 to 2025) and SBP Monetary Policy Statements.
Cycle One: 2016 to 2021
With the policy rate cut to 5.75% in May 2016, the KSE-100 rose 45.7% in CY16. The SBP's Financial Stability Review 2017 credits the run to May 2017 to Pakistan's reclassification into the MSCI Emerging Markets index, accommodative monetary policy, low inflation, CPEC activity and political stability.
The fall started before any rate hike. According to the same review, the decline began with new taxes on equity investments in the 2017-18 budget and a smaller-than-expected take-up by international investors after the MSCI upgrade, followed by political uncertainty. The KSE-100 closed CY17 15.3% lower while the policy rate was still 5.75%.
Strain then built in the wider economy. The Financial Stability Review 2018 describes widening twin deficits and inflation that forced stabilisation measures, a weaker rupee and a falling index. The SBP raised the policy rate from 5.75%, starting in January 2018, to 13.25% in July 2019, a 750 basis point (bps) increase, and the index lost a further 8.4% in CY18.
Recovery started in CY19 with stabilisation and the completion of the IMF's first review, then Covid struck. From the May 2017 peak to the March 2020 low, the index fell 48.5% across both episodes. Helped by policy stimulus and investors buying at low valuations, the index recovered to 33,931 by 29 May 2020, according to the Financial Stability Review 2019. The SBP had begun cutting on 17 March 2020, and by June 2020 it had taken the rate down 625 bps to 7%.
Cycle Two: 2021 to 2025
The external account came under pressure again. According to the Financial Stability Review 2022, petroleum imports alone jumped 86.2%, from USD 5.4 billion in the first half of 2021 to USD 10.1 billion a year later. The SBP began raising rates in September 2021 and took them to 22% by June 2023, a 1,500 bps climb. Floods and delayed IMF reviews added to the damage, and the KSE-100 fell 9.4% in CY22 as inflation kept climbing toward its peak of 38% in May 2023.
The turn came while conditions still looked grim. The Financial Stability Review 2023 shows the index rose only 2.6% in the first half of 2023 but 50.7% in the second half, with the policy rate still at 22%. Rate cuts from June 2024 then took the rate down 1,150 bps to 10.5% by December 2025, and the KSE-100 rose 84.3% in CY24 and 51.2% in CY25.
What Repeats and What Changes
Three things show up in both cycles above. The external account is the early warning: each boom ended with a widening deficit. The policy rate is the main lever, moving hundreds of basis points in each direction. And the stock market turns before the economy, often while headlines are still negative.
The triggers change. In 2017 it was new equity taxes, a disappointing MSCI upgrade and political uncertainty, followed by twin deficits in 2018; in 2020 a pandemic; in 2022 a higher oil import bill and floods. That is why, in our view, investors should study the sequence rather than wait for a repeat of a particular event.
Where the Cycle Stands in 2026
On 27 April 2026, the SBP raised the policy rate by 100 bps to 11.5%, citing the Middle East conflict, high energy and freight costs, and a risk of double-digit inflation. After three holds, it raised the rate by a further 50 bps to 12% on 26 October 2026, pointing to the intensifying Middle East conflict and persistently high energy prices.
In our view, these are strain signals from an external shock rather than an import boom. Whether they become a full tightening phase will depend on inflation, oil prices and the external account. For readers tracking the cycle, KIBOR rates and daily foreign and local investor flows say more than any single decision.
Using Market Cycles Without Trying to Time Them
Knowing the cycle helps you prepare, not predict. The 2023 rally began with the policy rate at 22%, and the 2020 rebound started within weeks of the low. Investors who sold in fear had little time to buy back in.
Many investors find it more practical to decide their mix of shares, fixed income and cash before the next downturn, and adjust it gradually as the cycle moves. Our guides on when to buy and sell stocks in Pakistan, long-term investing versus short-term trading and handling market volatility cover how to put that into practice.
Disclaimer: This article is for educational purposes only and should not be treated as investment advice. Stock investments carry market risk, and investors should consult a licensed financial advisor before making investment decisions.
Frequently Asked Questions
What drives market cycles on the PSX?
Mostly Pakistan's macroeconomic cycle. Periods of growth and cheap credit widen the current account deficit, which leads to rupee pressure, higher inflation and SBP rate hikes. When stability returns and rates fall, the market has tended to recover.
How long does a PSX market cycle last?
There is no fixed length. In the two most recent cycles, the KSE-100 went from the May 2017 peak to the March 2020 low in under three years, and from the 2022 slump past the 2017 record in November 2023, with further records in 2024, according to the SBP.
Does the KSE-100 recover before the economy?
Often, yes. In 2023 the index rose 50.7% in the second half while the policy rate was still 22%, and in 2020 it recovered sharply within weeks of the Covid low.
Can investors time PSX cycles?
Rarely with precision. Turning points tend to come while news is still negative, so many investors prefer a set asset allocation that they rebalance as conditions change.

Written by
Muhammad Abbas
CEO, Bhayani Securities (Pvt) Ltd.
Need Guidance?
Book a free consultation with our licensed investment advisors.